Visibility
Live
Refreshes as harmonized data arrives
Views
Role-aware
Sponsor, site, monitor, clinical-ops
Context
Endpoint-level
Per-patient, per-cohort, per-protocol
Dashboard Workflow
Watch → Drill → Decide → Act
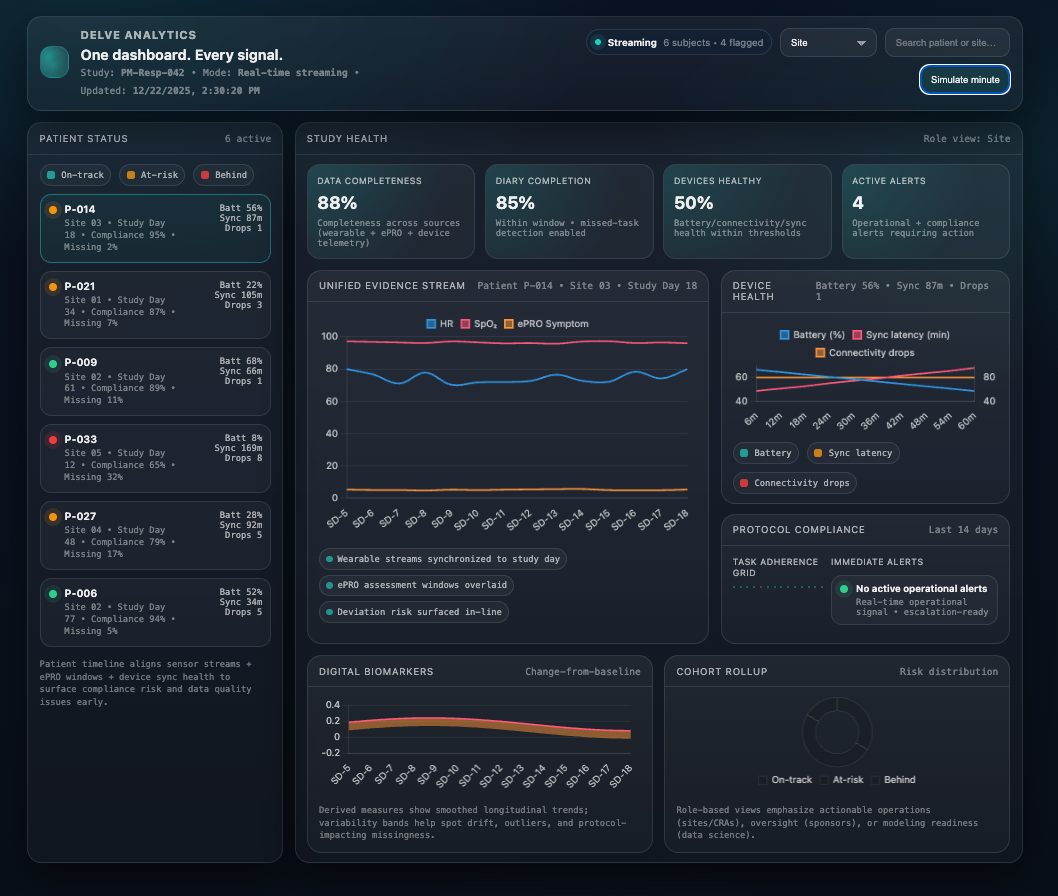
In clinical trials, an endpoint dashboard is the live view of harmonized digital endpoints — combining wearable signals, ePRO, and QC context — so the people running the study can act on what they see instead of waiting for the next report cycle.
Endpoint dashboards turn a slow analytical layer into a live operational one — without sacrificing the provenance regulators require.
Related pages: Digital Endpoints · Signal QC

Most dashboards are built on cleaned-and-frozen snapshots. By the time a team sees a problem on the dashboard, the operational window to recover has often closed.
Data refreshes weekly or monthly, so issues are surfaced after the window to recover.
Sites get the sponsor view and sponsors get the operations view, so nothing is fit-for-purpose.
Numbers without source-data lineage make reviewers wary of acting on what they see.
Vendor-reported quality flags are stripped before the chart is rendered.
Top-line trends can't be traced back to the patients or visits driving them.
Dashboards alert. Resolution lives in a different system. The loop never closes.
A dashboard that doesn't connect to operational action is a status indicator, not a decision tool.
Delve dashboards close the loop between oversight and operational action.
Dashboards that hold up under multi-year, multi-region trials are built around live data, role-based perspectives, and the provenance regulators expect.
A strong dashboard is not where work stops — it is where work starts.
See related pages: Analytics · Concierge · Closed-Loop Compliance
Once the dashboard is live and trustworthy, every decision-maker on the study works from the same picture — without waiting for monthly reporting cycles.
See site- and patient-level adherence as it happens, not as it's reported.
Watch device sync health and QC trends across the study population.
Track digital endpoints longitudinally without exporting to a separate tool.
Coordinators see their patient roster, follow-up tasks, and resolution times.
Drill from outliers to source signals while reviewing a case.
Live evidence the study is on track — not a quarterly report.
Dashboards are how harmonization, QC, and validation actually change how the trial is run day to day.
Dashboards refresh as harmonized data lands. For most wearables that's near-real-time; for ePRO it's as patients submit. Specific cadences depend on the study and the upstream device/app.
Yes. Sponsors, sites, ops, and medical monitors each get a perspective scoped to their decisions. The underlying data is the same.
Yes. Dashboards can co-exist with your EDC. We can also push the same harmonized endpoints into EDC via Endpoint APIs so the two stay aligned.
Delve combines real-time harmonization, signal QC, and operational workflows into a single dashboard layer that drives decisions instead of just describing them.
Book a Dashboard Walkthrough