Risk flagged early
< 24h
From first signal
Data latency
Near-real-time
Wearables + ePRO + endpoints
Query pressure
↓
With automated QC rules
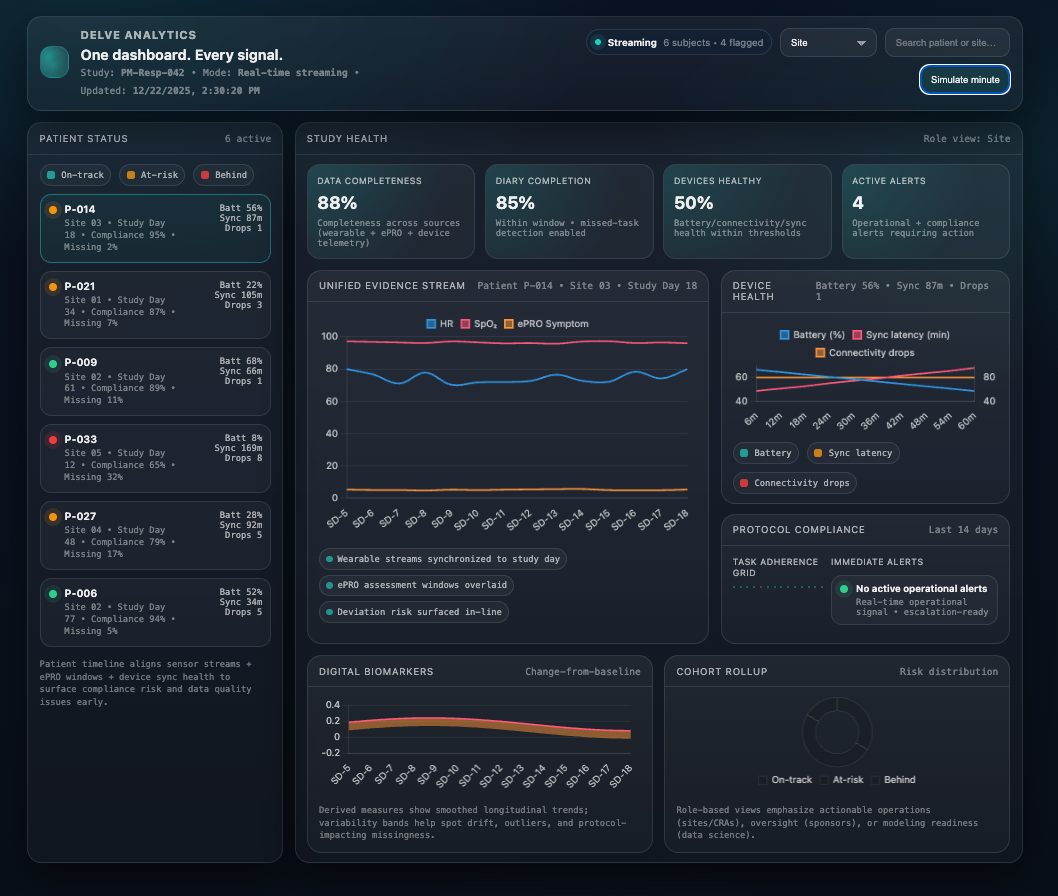
Study Health Dashboard
Live signals · Cross-source monitoring
One Dashboard. Every Signal.
Delve Analytics brings together wearable sensor streams, ePRO responses, device health, compliance, and digital biomarkers into a single, real-time platform built for modern research.
- Role-based dashboards for sites, CRAs, sponsors & data science teams
- Instant access to patient status, compliance, and data quality
- Device monitoring: battery, connectivity, sync health
- Wearable-derived biomarkers and trend modeling
- Immediate alerts when a patient falls behind
No more waiting weeks for vendor exports — evidence streams in continuously.
The Unified Delve Analytics Dashboard
Adaptively shows only the studies, sites, and patients tied to your role.
The Four Pillars of Delve Analytics
Study Oversight
Enrollment, randomization, study flow, deviations, missing tasks, and real-time quality metrics.
Patient-Level Insights
Sensor trends, PRO history, compliance curves, symptom patterns, and physiological changes — updated continuously.
Device Monitoring
Battery health, connectivity, missed syncs, wear-time estimation, device replacements, and troubleshooting flows.
Digital Endpoints
Wearable-derived biomarkers such as sleep, activity, HRV, gait, respiratory trends, and functional capacity indicators.
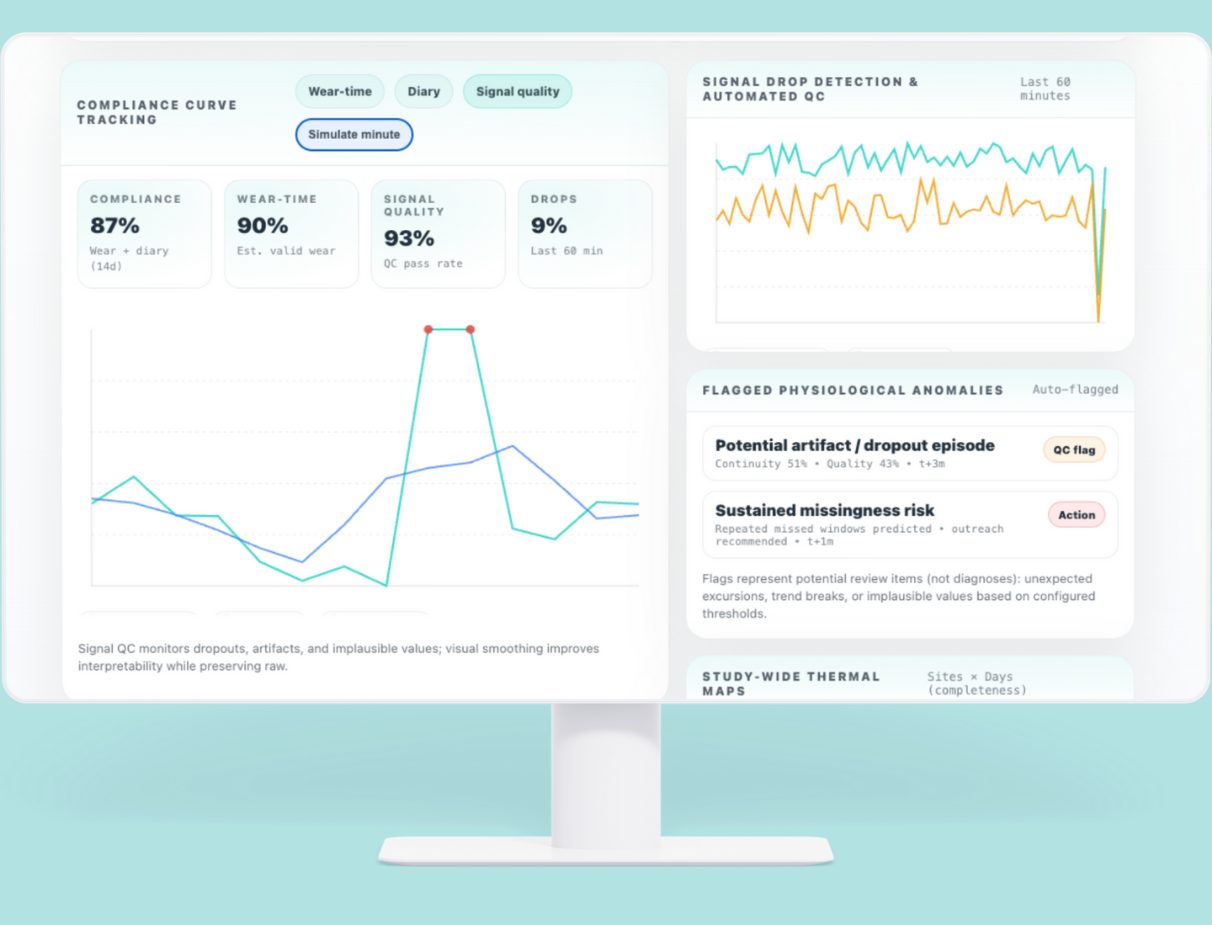
Compliance, Data Quality & Signal Health
Continuous research requires continuous insight. Delve monitors the full chain of evidence — from device to dashboard.
- Compliance curve tracking
- Wear-time estimation and accuracy
- Signal drop detection and automated QC
- Outlier removal and smoothing
- Flagged physiological anomalies
- Study-wide thermal maps
You see data the moment it changes — not weeks later.
Real-Time Compliance Monitoring
Operational readiness, scored every hour
Most platforms tell you something went wrong after a monitoring visit. Delve scores every patient's data readiness continuously across seven operational dimensions and surfaces a composite 0–100 score with explicit On track, Watch, and Action needed thresholds — per patient, per site, per study.
Sample study · 5 patients · last 72h
Parkinson's Continuous Monitoring
Coverage 77.0% · wear 71% · latency P95 8.1m
Per-patient, per-site, per-study
Roll up the same 7 dimensions at any level. Investigators see their site. Sponsors see the study. Operations sees individual patients.
Hour-by-hour, not week-by-week
Hourly readiness timeline, hour-of-day averages, and weekday patterns surface drift early — while recovery is still possible.
Triaged before sites are alerted
Watch-level signals route to Delve Concierge; only Action-level alerts reach research sites with full context and recommended next steps.
Audit-ready provenance
Every score links back to the underlying signals, algorithm version, device firmware, and timestamped patient interaction history.
Designed for Every Role in Research
Sponsors
Portfolio-level dashboards, risk detection, and early signals.
CRAs / MONs
Visit windows, missing tasks, and actionable site alerts.
Research Sites
Patient-level insights, onboarding status, and device troubleshooting.
Data Science Teams
Raw data access, algorithm outputs, and endpoint evaluations.
See Your Study in Real Time.
The dashboard designed for modern hybrid and decentralized research.
Book a Demo